Summary
A dramatic and surprising surge in atmospheric methane has emerged over the past several years. If not mitigated, this new trend could off-set the gains anticipated from the Paris Climate Agreement. In response, scientists have begun ringing alarm bells in several high-profile peer-reviewed publications.
Several sources have been identified as significant contributors to the surge, including U.S. production of oil and gas. And there is a firm consensus among scientists that the best response to the surge is a deep and rapid reduction in methane emissions from the production and distribution of natural gas.
Methane pollution from the fossil-fuel sector is responsible for a large share of anthropogenic methane emissions. And methane pollution from the production of oil and gas in particular is the most easily addressed source of methane. The International Energy Agency estimates that the global oil and gas industry can reduce 40-50% of methane emissions at zero net cost. Looking further, at options to replace natural gas altogether, clean alternatives to gas-fired power (e.g. utility-scale wind and solar power) are now cost-competitive and often even less-expensive.
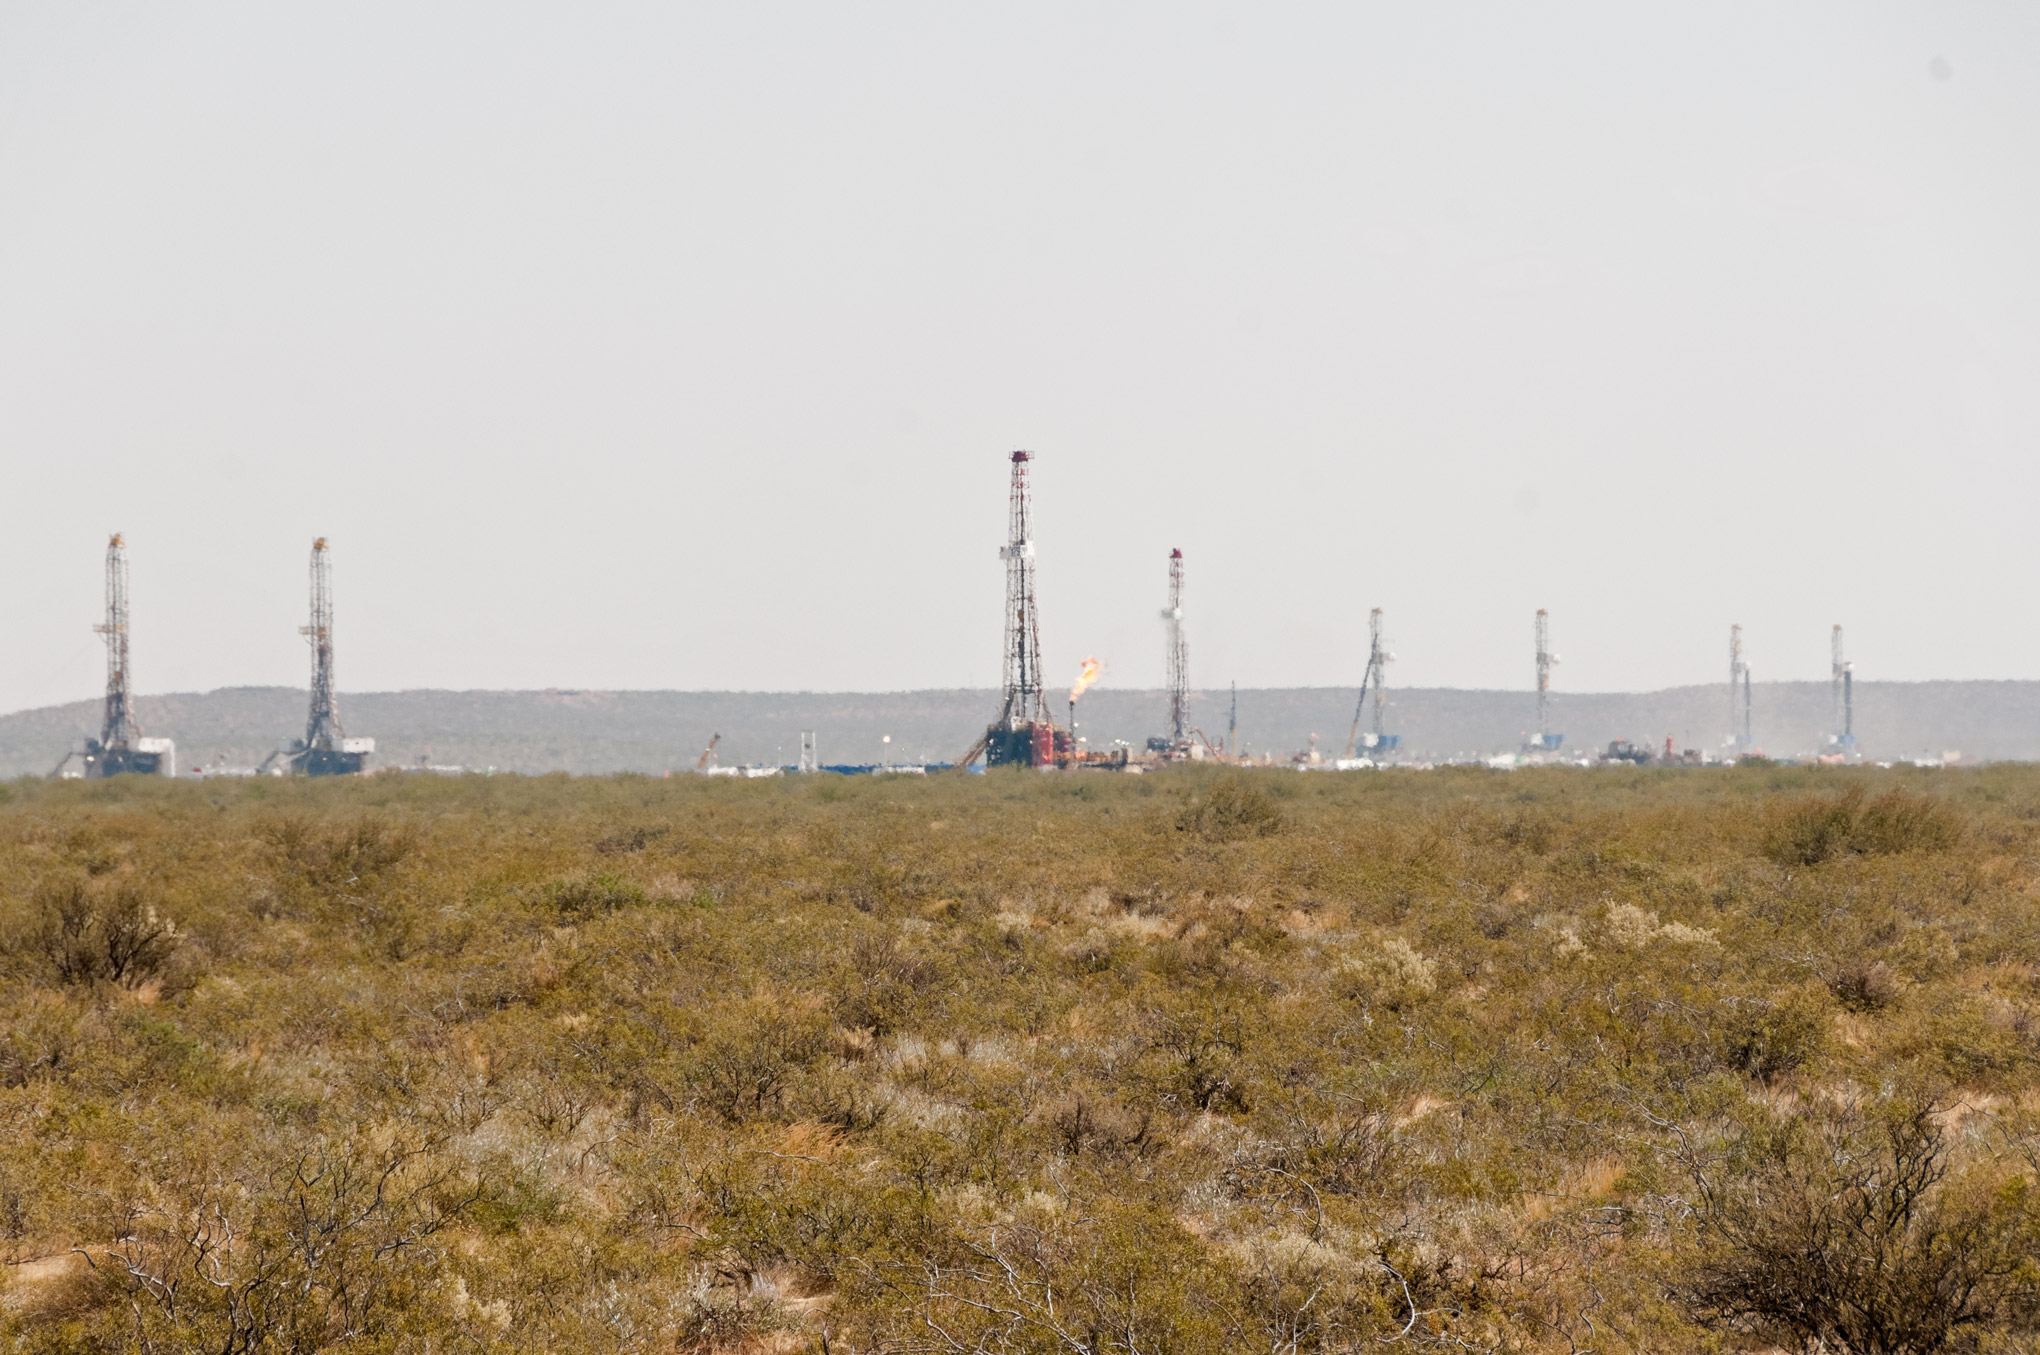
In the United States, the fossil fuel industry is the largest source of methane pollution, and emissions from the oil and gas sector in particular have grown at least 40% over the last decade. And in another disturbing trend, a string of field studies over the last two years has revealed major unaccounted-for methane emissions from the production of oil and gas in the U.S.
Overview
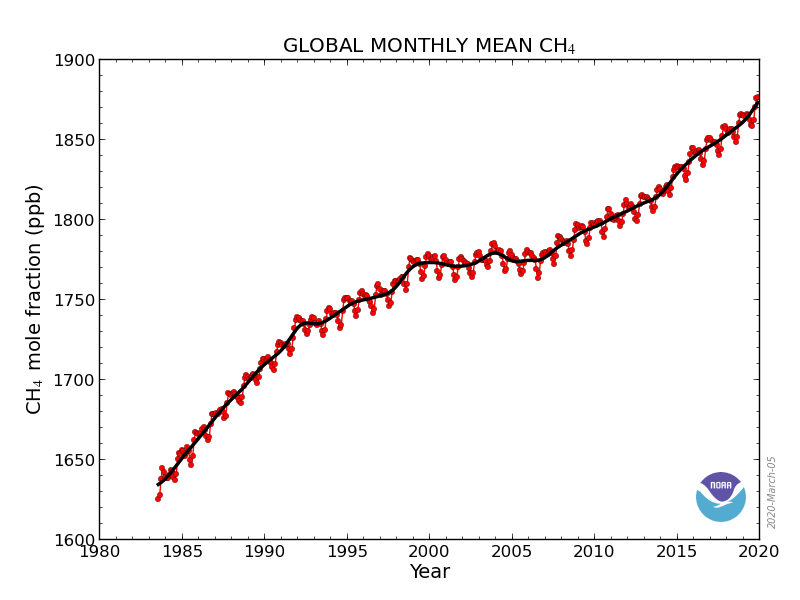 The preliminary estimate by NOAA for atmospheric methane in 2019 indicates that a recent unanticipated surge in atmospheric methane has continued. The year-over-year increase for 2019 is 11.5 ppb.[1] Even allowing for the maximum bias in this preliminary estimate (+/- 3 ppb) the final annual number for 2019 would stand as the 3rd biggest annual increase in methane over the last 20 years.[2]
The 2019 jump extends an unanticipated multi-year resurgence of atmospheric methane that has set off alarm bells in the science community. Scientists report that the new and unexpected methane increases threaten to virtually wipe out the anticipated gains of the Paris Climate Agreement, an agreement built upon models that assumed a stable level of methane in the atmosphere going forward.[3]
The “why” behind this resurgence is being intensely investigated. The most recent authoritative assessment finds that anthropogenic (human-made) sources are estimated to contribute almost all of the additional methane emitted globally to the atmosphere for 2017 compared to 2000–2006. Fossil fuel extraction and agriculture around the world are identified as the two primary drivers globally. North American fossil fuel emissions are identified as among the significant contributors to the global surge. Fossil fuel methane emissions from the United States account for 80 percent of the increase in North American methane emissions over the study period (2000-2006 v 2017). This increase is largely driven by gas and oil extraction. [Saunois et al 2020 and Jackson et al 2020].[5]
However, the answer to the question about which emissions sources are driving the methane surge is very different from the answer to the question about which emissions source is best targeted in order to address the surge. It is extremely challenging, if not impossible, to control how wetlands respond to climate change.
There is wide agreement among experts that reducing emissions from fossil-fuel production and distribution, primarily through ending leaks and venting, is one of the few options available to control global methane levels, and they agree that this option is the most practical one.[6] In addition, scientists report that there are narrow opportunities to address agricultural emissions, e.g. changes in the diet of livestock that can reduce the production of methane without affecting production.
Methane pollution from the oil and gas sector is responsible for a very large share of current anthropogenic emissions, and this stream of pollution sustains methane in the atmosphere at a level far above pre-industrial conditions. About 40% of methane comes from natural sources (wetlands and natural wildfires), while 60% comes from anthropogenic sources (agriculture, waste treatment, coal mine seeps, and oil/gas production). Fossil-fuel methane emissions account for roughly 34% of the anthropogenic emissions.[7]
The most recent isotope research reports that methane emissions from fossil fuel production are under-estimated by as much as 40%, while natural geologic sources contribute correspondingly less (relative to the shares reported in the paragraph above). Though disturbing, these findings include a silver lining. They indicate that better management of methane emissions from fossil-fuel production and distribution would have an even greater impact on global methane levels than understood prior.[8]
In the United States, the natural gas and petroleum system is the largest source of methane emissions or the 2nd largest source if one groups manure management with enteric fermentation.[9] The most recent analysis suggests that U.S. methane emissions from oil and gas activity have increased over the last 10 years at 3.4% per year [10], about 40% over the decade, in line with increased production [11], while livestock emissions have been flat. One analysis has identified growing emissions from U.S. manure management as one contributor to the surge. [Shaefer 2019]
Looking forward, an analysis by the Rhodium Group finds that “if the natural gas boom in the US continues, and the Trump administration is successful in walking back Obama-era regulation, the oil and gas sector could see a nearly 30% increase in methane emissions from today’s levels by 2025.”[12]
Detail
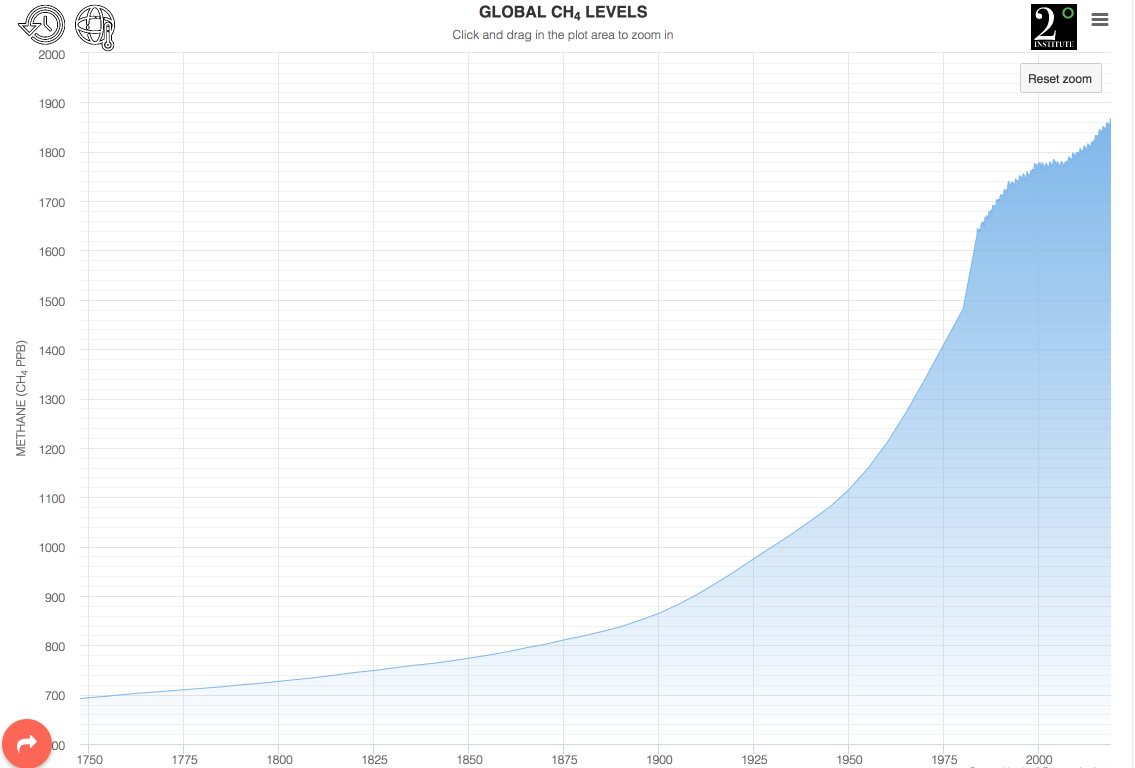
Methane is a short-lived but super-potent greenhouse gas and is the second most important contributor to anthropogenic global warming after CO2, accounting for one-quarter of the anthropogenic radiative imbalance (the human forcing of warming) since the pre-industrial era.[13] Prior to the industrial era global methane levels were low and relatively stable for the last 800,000 years, ranging from 300–800 ppb. With the advent of modern agriculture and then fossil fuel operations, methane levels skyrocketed to more than 1,800 ppb.[14]
 Starting in the 1990s, the growth in global methane levels began to slow down, and global methane became relatively stable over the period of 2000-2006. A resurgence of global methane was not anticipated and came as a surprise.[15] Crucially, methane levels were forecast to be stable in the pathway models prepared for the Paris Climate Agreement.[16]
Atmospheric methane resumed rapid growth starting in 2007. Growth accelerated further starting in 2014, extending through 2018.[17] This exceptional growth continued in 2019.[18] The rate of methane increase accelerated beginning in 2014, jumping 50 percent over the growth rate observed 2007-2013.[19] The sustained growth of the last six years was last observed in the 1980s when the Soviet Union’s gas industry was developing very rapidly.[20]
At first the durability of this emerging trend was questioned, and years of rapid growth were seen as anomalies.[21] However, the period of resumed growth in global methane levels now stands at 13 years (2007-2019) compared to the 7-year period of stable methane levels (2000-2006).
In this light, the era of stable global methane levels is increasingly seen as the anomaly, and growth in global methane seen as the resumption of a long-standing trend.[NB:22] This emerging consensus is highlighted in several recent high-profile papers representing the consensus view of a large array of experts in the field.[23]
The threat posed by this resumption in methane growth is significant. A group of 23 scientists reports: “Thus even if anthropogenic CO2 emissions are successfully constrained to a RCP2.6-like pathway, the unexpected and sustained current rise in methane may so greatly overwhelm all progress from the other reduction efforts that the Paris Agreement will fail.”[24]
While the resumption of growth in global methane is now well documented and behind the surge have recently come largely into focus, there are still gaps in knowledge. Present global environmental monitoring networks only provide sparse information about methane concentrations, making it challenging and complex to distinguish between the myriad individual sources of methane from the fossil fuel industries, and dispersed sources like wetlands and agriculture. Gaps in monitoring also make it impossible to rule out a decrease in the efficacy of natural mechanisms that sweep methane from the atmosphere (aka “sinks”).[25]
Potential drivers of increased emissions include emissions from intensive agricultural practices [Chang et al], emissions from oil and gas operations, seepage from coal mines [Kholod et al], and increased emissions from wetlands responding to global warming.[26] [This last potential driver is particularly worrisome as it implies the engagement of a global warming feedback loop.][27]
A number of studies have assigned and evaluated the role of each of these drivers, with different studies assigning greater weight to different drivers; all are generally considered to play at least a minor role.[28]
The most recent authoritative assessment, issued by the Global Carbon Project, finds that anthropogenic (human-made) sources are estimated to contribute almost all of the additional methane emitted globally to the atmosphere for 2017 compared to 2000–2006. Fossil fuel extraction and agriculture around the world are identified as the two primary drivers globally, and North American fossil fuel emissions are identified as among the significant contributors to the global surge. Fossil fuel methane emissions from the United States account for 80 percent of the increase in North American methane emissions over the study period (2000-2006 v 2017). This increase is largely driven by gas and oil extraction. [Saunois et al 2020 and Jackson et al 2020].
The IPCC Special Report on Climate Change and Lands finds that “ruminants and the expansion of rice cultivation are important contributors to the rising concentration” of atmospheric methane. Chapter 2 of the Report further finds that “Fugitive emissions likely contribute to the renewed growth after 2006” and points to increased fracking in America as a contributor: “the increased production of natural gas in the US from the mid 2000’s is of particular interest because it coincides with renewed atmospheric aCH4 growth” and notes that “The importance of fugitive emissions in the global atmospheric accumulation rate is growing.”
Most recently, separate individual studies have delivered a range of estimates about the relative role of fracking in North America. The estimates range from a significant role to a major role. One recent isotope analysis indicates that fracking may be the major driver of the recent multi-year surge of global methane above the elevated baseline.[29] Yet, another recent isotope analysis examining a large isotope inventory concludes that U.S. fracking is a contributor but not the primary driver of the global surge.[30]
Ethane and propane emissions are used as proxies for tracking methane emissions from fossil fuel operation, and studies tracking ethane and propane assign a significant role to U.S. fossil production in driving the surge in global methane.[31]
Recent research has also revealed that natural gas pipelines in U.S. metropolitan areas are now leaking significant levels of methane, at twice the rate previously believed.[32]
A recent analysis of satellite data estimates that the increase in methane emissions from the U.S. oil and gas system over the years 2010 to 2016 was responsible for 10% of the surge in global methane over those years (from all sources natural and anthropogenic).[33] This estimate of the share of the surge is more than twice the U.S. share of the global human population (4%).
Another recent global inventory analysis attributes the global surge to “a combination of factors; rapid growth in extraction of unconventional gas in North America, extended coal mining in Indonesia, and accentuated growth in waste and wastewater emissions in rapidly developing world regions.”[34]
A very recent string of field level studies in the U.S. have found methane emissions from the U.S. oil and gas sector to be far higher than EPA estimates.[35] One very recent study of the Permian Basin in the U.S. found emission rates to be more than twice than previously estimated.[36] This basin provides more than 30% of current U.S. oil production and was developed parallel with the expansion of natural gas production in the U.S. and the global surge in atmospheric methane. The Permian Basin methane emissions alone are equivalent to 10% of the global surge.[37]
Older review papers allow a role for U.S. oil and gas production in the methane surge but tend to discount a primary role, generally pointing instead to emissions from tropical wetlands and other sources, though they acknowledge uncertainty on this question.[38]
While the size of the role of fossil-fuel production and distribution in driving the recent surge in global methane is still under investigation, it is already well documented that fossil-fuel production is one of the major drivers in sustaining industrial era methane levels.[39] As a result, reducing fossil-fuel methane emissions would have a significant impact in addressing impact of the methane surge. The lifetime of methane in the atmosphere is relatively short (∼11 years), i.e. it washes out of the atmosphere fairly quickly (unlike CO2). Thus, large anthropogenic emissions are required to simply sustain the elevated global methane levels of the industrial era. A significant reduction in anthropogenic emissions quickly translates into a reduction in atmospheric methane.
Fossil-fuel methane emissions are also the most easily addressed source of emissions. The International Energy Agency estimates industry can reduce its worldwide emissions by 75 percent—and that up to two-thirds of those reductions (40-50% of total emissions) can be realized at zero net cost.[40]
In addition, there are particular opportunities to address emissions from agriculture. Changes in the diet of livestock could reduce the production of methane in dairy cattle without reducing milk production.[41]
In this context the 23 authors of Nisbet et al wrote: “We may not be able to influence the factors driving the new rise in methane, especially if it is a climate change feedback, but by monitoring, quantifying and reducing the very large anthropogenic inputs, especially from the gas, coal and cattle industries, and perhaps by direct removal, we may be able to cut the total methane burden to be compliant with the Paris goals.”[42]
For more information, contact: Hunter Cutting, [email protected]
References
- Alvarez et al. (2018): Assessment of methane emissions from the U.S. oil and gas supply chain. Science. July 2018. DOI: 10.1126/science.aar7204. https://science.sciencemag.org/content/361/6398/186
- Barkley et al. (2019: Forward Modeling and Optimization of Methane Emissions in the South Central United States Using Aircraft Transects Across Frontal Boundaries, Geophysical Research Letters (2019). DOI: 10.1029/2019GL084495
- Climate Nexus (2020): Atmospheric Methane Concentration Year-Over-Year Monthly Increase Worksheet. March 26, 2020. https://docs.google.com/spreadsheets/d/17IqUt7EDT-bQ70gwkbNxipgMWWScnlejpBH-b5rtTE4/edit?usp=sharing
- Chang et al (2019): Revisiting enteric methane emissions from domestic ruminants and their δ13CCH4 source signature. Nature Communications. July 2019. https://www.nature.com/articles/s41467-019-11066-3
- Dalsøren et al. (2018): Discrepancy between simulated and observed ethane and propane levels explained by underestimated fossil emissions. Nature Geoscience. https://doi.org/10.1038/s41561-018-0073-0
- Dean et al. (2018): Methane Feedbacks to the Global Climate System in a Warmer World. Reviews of Geophysics. January 2018. https://doi.org/10.1002/2017RG000559
- Duren et al. (2019): California’s methane super-emitters. Nature. DOI: 10.1038/s41586-019-1720-3
- EPA Greenhouse Gas Inventory: https://www.epa.gov/ghgemissions/overview-greenhouse-gases
- Fletcher and Schaefer (2019): Rising Methane A new climate challenge. Science. June 2019. DOI: 10.1126/science.aax1828 https://science.sciencemag.org/content/364/6444/932
- Gabbatiss, J. (2020) Coal mines emit more methane than oil-and-gas sector, study finds. Carbon Brief. https://www.carbonbrief.org/coal-mines-emit-more-methane-than-oil-and-gas-sector-study-finds
- Ganeson et al. (2019): Advancing Scientific Understanding of the Global Methane Budget in Support of the Paris Agreement. Global Biogeochemical Cycles. December 2019. https://doi.org/10.1029/2018GB006065
- Hakola and Hellén, (2016): The return of ethane. Nature GeoScience. July 2016. https://doi.org/10.1038/ngeo2736
- Hausmann et al (2016): Contribution of oil and natural gas production to renewed increase in atmospheric methane (2007-2014): top-down estimate from ethane and methane column observations. Atmospheric Chemistry and Physics. DOI:10.5194/acp-16-3227-2016
- http://www.atmos-chem-phys.net/16/3227/2016/
- He et al. (2019): Atmospheric Methane Emissions Correlate with Natural Gas Consumption from Residential and Commercial Sectors in Los Angeles. Geophysical Research Letters. July 2019. https://agupubs.onlinelibrary.wiley.com/doi/abs/10.1029/2019GL083400
- Helmig et al. (2016): Reversal of global atmospheric ethane and propane trends largely due to US oil and natural gas production. Nature GeoScience. June 2016. https://doi.org/10.1038/ngeo2721
- Hmiel et al (2020): Preindustrial 14CH4 indicates greater anthropogenic fossil CH4 emissions. Nature. February 2020. https://www.nature.com/articles/s41586-020-1991-8
- Höglund-Isaksson et al 2020: Technical potentials and costs for reducing global anthropogenic methane emissions in the 2050 timeframe –results from the GAINS model. Environmental Research Communications. February 2020. https://iopscience.iop.org/article/10.1088/2515-7620/ab7457
- Howarth (2019): Is shale gas a major driver of recent increase in global atmospheric methane? Biogeosciences. August 2019. https://www.biogeosciences.net/16/3033/2019/
- International Energy Agency (2020): Methane Emissions from Oil and Gas. Tracking Fuel Supply. https://www.iea.org/reports/tracking-fuel-supply-2019/methane-emissions-from-oil-and-gas
- Jackson et al. (2020):Increasing anthropogenic methane emissions arise equally from agricultural and fossil fuel sources. Environmental Research Letters. June 2020. In pre-press.
- Jacobson et al. (2018): Chapter 8: Observations of atmospheric carbon dioxide and methane. In Second State of the Carbon Cycle Report (SOCCR2): A Sustained Assessment Report [Cavallaro, N., G. Shrestha, R. Birdsey, M. A. Mayes, R. G. Najjar, S. C. Reed, P. Romero-Lankao, and Z. Zhu (eds.)]. U.S. Global Change Research Program, Washington, DC, USA, pp. 337-364, https://doi.org/10.7930/SOCCR2.2018.Ch8.
- Kholod et al. (2020). Global methane emissions from coal mining to continue growing even with declining coal production. Journal of Cleaner Production. May 2020.https://doi.org/10.1016/j.jclepro.2020.120489
- Lan et al. (2019): Long‐Term Measurements Show Little Evidence for Large Increases in Total U.S. Methane Emissions Over the Past Decade. Geophysical Research Letters. April 2019. https://doi.org/10.1029/2018GL081731
- Lunt et al. (2019): An increase in methane emissions from tropical Africa between 2010 and 2016 inferred from satellite data, Atmospheric Chemistry and Physics (2019). https://doi.org/10.5194/acp-19-14721-2019
- Lyon and Schwietzke (2019) Does new NOAA study really show that methane emissions have been overestimated? No. Energy Exchange. EDF. May 2019
- Maasakkers et al. (2019): Global distribution of methane emissions, emission trends, and OH concentrations and trends inferred from an inversion of GOSAT satellite data for 2010–2015. Atmospheric Chemistry and Physics. January 2019. https://doi.org/10.5194/acp-19-7859-2019
- Magill (2020): Permian Oil Fields Leak Enough Methane for 7 Million Homes. Bloomberg. April 22, 2020. https://www.bloomberg.com/news/articles/2020-04-22/permian-basin-oil-fields-leak-enough-methane-for-7-million-homes?cmpid=BBD042320_GREENDAILY&sref=JN1HDH2Z
- Milkov et al. (2020). Using global isotopic data to constrain the role of shale gas production in recent increases in atmospheric methane. Scientific Reports. https://doi.org/10.1038/s41598-020-61035-w
- Muehlenbachs and Arismendi (2020). The Isotopic Composition Of Fugitive Greenhouse Gases From Energy Wells Of The Western Canada Sedimentary Basin. AGU Presentation. December 2020. https://agu.confex.com/agu/fm19/meetingapp.cgi/Paper/520383
- Negron et al 2020: Airborne Assessment of Methane Emissions from Offshore Platforms in the U.S. Gulf of Mexico. Environmental Science and Technology. April 2020. https://pubs.acs.org/doi/10.1021/acs.est.0c00179
- Nisbet et al. (2019): Very Strong Atmospheric Methane Growth in the 4 Years 2014–2017: Implications for the Paris Agreement. Global Biogeochemical Cycles. March 2019. https://doi.org/10.1029/2018GB006009
- NOAA AGGI 2019. Rising Emissions Drive Greenhouse Gas Index Increase. NOAA Research News. 21 May 2019 https://research.noaa.gov/article/ArtMID/587/ArticleID/2455/RISING-EMISSIONS-DRIVE-GREENHOUSE-GAS-INDEX-INCREASE
- NOAA/ESRL: Earth System Research Laboratory Global Monitoring Division. https://esrl.noaa.gov/gmd/ccgg/trends_ch4/
- Nisbet et al. (2019): Very Strong Atmospheric Methane Growth in the 4 Years 2014–2017: Implications for the Paris Agreement. Global Biogeochemical Cycles. March 2019. https://doi.org/10.1029/2018GB006009
- Perkins S. (2019): Major U.S. cities are leaking methane at twice the rate previously believed. Science. https://www.sciencemag.org/news/2019/07/major-us-cities-are-leaking-methane-twice-rate-previously-believed
- Petrenko et al. (2017): Minimal geological methane emissions during the Younger Dryas–Preboreal abrupt warming event. Nature, 2017; 548 (7668): 443 DOI: 10.1038/nature23316 https://www.sciencedaily.com/releases/2017/08/170824121433.htm
- Pitt et al. (2019): Taking Stock 2019. Rhodium Group. July 2019. https://rhg.com/research/taking-stock-2019/
- Plant et al. (2019): Large Fugitive Methane Emissions From Urban Centers Along the U.S. East Coast. Geophysical Research Letters. https://doi.org/10.1029/2019GL082635
- Saunois et al. (2017): Variability and quasi-decadal changes in the methane budget over the period 2000–2012. Atmospheric Chemistry and Physics. September 2017. https://www.atmos-chem-phys.net/17/11135/2017/acp-17-11135-2017.html
- Saunois et al (2020): The Global Methane Budget 2000-2017. Earth Syst. Sci. Data, 12, 1–63, June 2020. In pre-press.
- Schaefer H. (2019): On the Causes and Consequences of Recent Trends in Atmospheric Methane. Current Climate Change Reports. December 2019. https://doi.org/10.1007/s40641-019-00140-z
- Sheng et al (2018): 2010–2016 methane trends over Canada, the United States, and Mexico observed by the GOSAT satellite: contributions from different source sectors. Atmospheric Chemistry and Physics. August 2018. https://doi.org/10.5194/acp-18-12257-2018
- Shindell et al. (2017): The social cost of methane: theory and applications. Faraday Discussions. January 2017 DOI: 10.1039/c7fd00009j
- Turner et al. (2016): A large increase in U.S. methane emissions over the past decade inferred from satellite data and surface observations. Geophysical Research Letters. https://agupubs.onlinelibrary.wiley.com/doi/full/10.1002/2016GL067987
- Turner, Frankenberg, and Kort (2019): Interpreting contemporary trends in atmospheric methane. Proceedings of the National Academy of Sciences. 19 February 2019.
- Underwood (2019): Rising Methane Emissions Could Derail the Paris Agreement. EOS. 19 April 2019. https://eos.org/research-spotlights/rising-methane-emissions-could-derail-the-paris-agreement
- University of Oklahoma (2020): Study finds the fingerprint of paddy rice in atmospheric methane concentration dynamics. PHYS.ORG. February 2020.
- https://phys.org/news/2020-02-fingerprint-paddy-rice-atmospheric-methane.amp
- Worden et al. (2017): Reduced biomass burning emissions reconcile conflicting estimates of the post-2006 atmospheric methane budget. Nature Communications. December 2017. https://doi.org/10.1038/s41467-017-02246-0
- Zhang G. et al. (2020): Fingerprint of rice paddies in spatial–temporal dynamics of atmospheric methane concentration in monsoon Asia, Nature Communications (2020). DOI: 10.1038/s41467-019-14155-5
- Zhang Y. et al. (2020) Quantifying methane emissions from the largest oil-producing basin in the United States from space. Science Advances. April 2020. https://advances.sciencemag.org/content/6/17/eaaz5120
[1] NOAA/ESRL.
[2] NOAA/ESRL.
[3] Nisbet et al., 2019. Turner, Frankenberg, and Kort, 2019. Ganeson et al. 2019. Fletcher and Schaefer, 2019.
[4] Nisbet et al., 2019. Turner, Frankenberg, and Kort, 2019. Ganeson et al. 2019. Fletcher and Schaefer, 2019. Maasakkers et al., 2019. Saunois et al. 2017.
[5] See, for example, Howarth, 2019; Milkov, 2020; Zhang 2020, and Worden, 2017.
[6] Nisbet et al., 2019. Turner, Frankenberg, and Kort, 2019. Schaefer, 2019. Milkov et al 2020.
[7] Saunois, 2017. Dean et al., 2018. Ganeson et al 2019.
[8] Hmiel et al 2020. Dalsøren et al., 2018. Petrenko et al., 2017.
[9] EPA GHG Emissions Inventory.
[10] Lan et al. 2019.
[11] Lyon and Schwietzke, 2019. Milkov et al 2020.
[12] Pitt et al., 2019.
[13] Ganeson et al 2019. Turner, Frankenberg, and Kort, 2019.
[14] Dean et al., 2018. Ganeson et al 2019.
[15] Nisbet et al., 2019. Turner, Frankenberg, and Kort, 2019. Underwood, 2019.
[16] Nisbet et al., 2019.
[17] Nisbet et al., 2019. Turner, Frankenberg, and Kort, 2019. Underwood, 2019.
[18] NOAA/ESRL: Earth System Research Laboratory Global Monitoring Division.
[19] Nisbet et al., 2019.
[20] Nisbet et al., 2019.
[21] Turner, Frankenberg, and Kort, 2019.
[22] While the upward trend in concentrations has resumed, the trend in isotope ratio has changed. See Turner et al., 2019.
[23] Nisbet et al., 2019. Turner, Frankenberg, and Kort, 2019. Fletcher and Schaefer, 2019. Maasakkers et al., 2019. Schaefer, 2019. Milkov et al 2020.
[24] Nisbet et al., 2019.
[25] Ganeson et al 2019. Maasakkers et al., 2019.
[26] Ganeson et al 2019. Maasakkers et al., 2019. Nisbet et al., 2019. Turner, Frankenberg, and Kort, 2019. Fletcher and Schaefer, 2019.
[27] Fletcher and Schaefer, 2019. Schaefer, 2019.
[28] Nisbet et al., 2019. Turner, Frankenberg, and Kort, 2019. Fletcher and Schaefer, 2019. Maasakkers et al., 2019. Schaefer, 2019. Milkov et al 2020.
[29] Howarth, 2019.
[30] Milkov, 2020.
[31] Dalsøren et al., 2018. Hausmann et al 2016. Helmig et al. 2016. Hakola and Hellén, 2016.
[32] Perkins, 2019. He et al. 2019
[33] Sheng et al, 2018.
[34] Höglund-Isaksson et al 2020.
[35] See: Zhang Y. et al. 2020; Duren et al. 2020; Negron et al. 2020; Barkley et al 2019; Plant et al. 2019; Alvarez et al. 2018.
[36] Zhang Y. et al., 2020.
[37] See Howarth in Magill, 2020.
[38] Schaefer, 2019. Maasakkers et al., 2019. Nisbet et al., 2019. Saunois et al. 2017.
[39] Dean et al., 2018. Nisbet et al., 2019. Turner, Frankenberg, and Kort, 2019. Hmiel et al. 2020.
[40] International Energy Agency, 2020.
[41] Turner et al. 2019. Shindell, 2017.
[42] Nisbet et al., 2019.