Climate Change Impacts
 Arizona • California • Colorado • Nevada • New Mexico • Utah
 Arizona • California • Colorado • Nevada • New Mexico • Utah
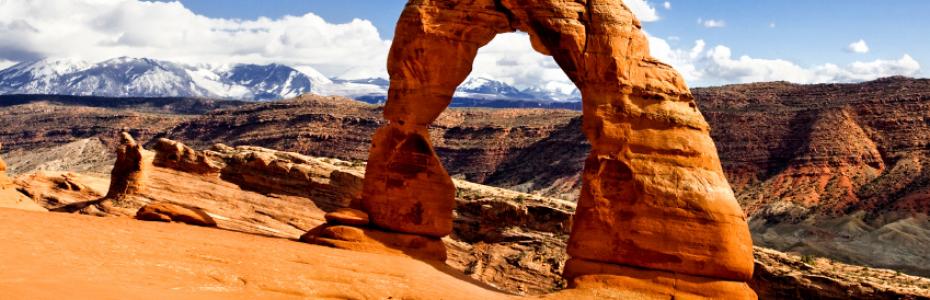
The following is a compilation of climate change impacts occurring right here, right now in the Southwest, as well as projected impacts, economic and human health consequences, and notable recent events. The Southwest is home to 56 million inhabitants and is the hottest and driest region in the United States. Climate change already poses a challenge to the Southwest, from extreme heat to sea level rise, and conditions are likely to increase in severity.
Extreme Heat
Right Here, Right Now
- Over the past 30 years, the average Southwest resident experienced 40 days per year of temperatures 95°F or more.
- The decade 2001-2010 was the warmest in the 110-year instrumental record, with temperatures almost 2°F higher than historic averages, with fewer cold air outbreaks and more heat waves.
- Since the 1980s, heat waves over California and Nevada are not simply increasing in frequency and intensity but are also changing their character: they arebecoming more humid and therefore are expressed more strongly in nighttime rather than daytime temperatures.
Figure: Projected temperature increases relative to a 1971-1999 baseline.

Projected Trends
- By mid-century the average Southwest resident will likely see 13 to 28 additional extremely hot days that are 95°F or more.
- By the end of the century, residents will likely experience 33 to 70 additional extremely hot days, or one to two additional months of days over 95°F each year.
- With continued growth in global emissions, regional annual average temperatures are projected to rise by 2.5°F to 5.5°F by mid century and by 5.5°F to 9.5°F by the end of the century.
- If global emissions are substantially reduced, projected temperature increases are 2.5°F to 4.5°F by mid-century, and 3.5°F to 5.5°F by the end of the century.
- Summertime heat waves are projected to become longer and hotter, and wintertime cold air outbreaks will continue to decrease.
- Babies born right now could see four additional months of days of 95°F within their lifetimes.
Economic Impacts
- Rising temperatures impact crop yields and productivity of key regional crops, such as fruit trees.
- Extremely hot days directly affect urban infrastructure through increased risk of disruptions to electric power generation and leave less water available for critical industries such as agriculture.
Impacts to Human Health and Wellbeing
- Heat ranks among the deadliest of all natural hazards and is the leading weather-related cause of death in the U.S., with the highest rates of heat stress in Arizona. Rising temperatures and extreme heat will continue to increase the risk of heat stress.
- Extreme heat threatens urban infrastructure and urban residents. At 92.7%, the Southwest has the highest percentage of people who live in cities relative to 80.7% nationwide. Nevada is even higher, at 94.2%. Increased heat can create a domino effect that impacts millions. For example, an 11-minute power disturbance in 2011 led to 1.5 million San Diego residents to lose power for 12 hours. The outage also caused problems with pumps and water service, leading to 1.9 million gallons of sewage being spilled near beaches.
Recent Events
- Arizona and California had a record warm start to 2014, with January through March temperatures more than 5°F above average. The first six months of the year were the hottest ever in California and Phoenix.
- In 2013, Colorado had record heat with Denver experiencing the earliest 100° day on record.
- Arizona, California, New Mexico, and Utah had a top ten warm fall season in 2013, and Nevada had its warmest autumn on record with a statewide average temperature of 53.8°F which was 3.7°F above average.
- In a 10-day California heat wave in 2006, over 650 people died due to heat-related conditions.
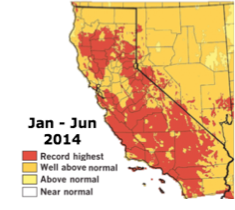
Figure: Early 2014 California temperature anomalies.
Extreme Precipitation
Right Here, Right Now
- Compared to relatively uniform regional temperature increases, precipitation trends vary considerably across the region, with portions experiencing decreases and others experiencing increases.
Projected Trends
- Extreme precipitation events are projected to increase in severity even in regions where total precipitation is generally expected to decrease because warmer air holds more moisture.
- Much of the Southwest is within reach of an important class of Pacific storms often referred to as “atmospheric rivers.” An increase in winter flood hazard risk in rivers is projected due to increases in flows of atmospheric rivers into California’s coastal ranges and the Sierra Nevada.
- By mid-century, atmospheric river storms from the Pacific are projected to increase by an average of about 30% per year and about twice as many years are projected to have many more than historical numbers of these storms.
- The North American monsoon (NAM) is the source of summertime precipitation for much of the Southwest, particularly Arizona and New Mexico. Great challenges in monsoon modeling prevent confident conclusions about the future of NAM, especially its extremes.

Economic Impacts
- September 2013 floods in Colorado are estimated to have caused economic damages greater than $2 billion. In Estes Park, the most impacted region, road and bride damage will limit access to the Rocky Mountain National Park with potentially large economic costs for the 2014 tourist season. Most financial losses were borne by residents, since very little flood risk is insured.
Impacts to Human Health and Wellbeing
- More frequent and intense precipitation contributes to increased flooding, which threatens infrastructure, homes, and lives. Warming also plays an important role as it results in wintertime precipitation falling as rain rather than snow.
- September 2013 floods in Colorado resulted in multiple fatalities with an estimated 1,500 homes destroyed, and thousands more damaged in over 17 counties.
Recent Events
- The summer of 2013 was the eighth wettest on record for the continental U.S. and the wettest since 2004. Record and near-record wet conditions were observed in the Southwest.
- Narrow corridors of concentrated moisture in the atmosphere, known as atmospheric rivers, have contributed to the largest floods in California history and can penetrate inland as far as Utah and New Mexico.
- Heavy precipitation, exceeding 455 mm in some locations, fell during September 2013 in Colorado. From September 9-16, a cut-off low-pressure system pumped deep tropical moisture into the Colorado Front Range, resulting in record precipitation. Streams and rivers approached and exceeded record levels, causing widespread flooding.
- Colorado had its wettest September on record with 312% of average precipitation.

Drought
Right Here, Right Now
- The early 21st century drought in the Colorado River basin has been the most extreme in over a century of Colorado River flows and is linked to climate change. Models project more intense droughts in the Colorado River basin, with flow deficits that exceed any in the observational record by 60-70%.
- Over the past 50 years, there has been less late-winter precipitation falling as snow, earlier snowmelt, and earlier arrival of most of the year’s streamflow.
- Streamflow totals in the Sacramento-San Joaquin, the Colorado, the Rio Grande, and in the Great Basin were 5% to 37% lower between 2001 and 2010 than the 20th century average flow.
Projected
- Future droughts are projected to be substantially hotter. For major river basins such as the Colorado River Basin,drought is projected to become more frequent, intense, and longer lasting than in the historical record.
- With rising emissions, consistent reductions in winter and spring precipitation are projected for the southern part of the Southwest by 2100.
- The amount of water held in a volume of snow, or snow water equivalent (SWE), is projected to decline throughout the century. For watersheds that depend on snowpack to provide the majority of the annual runoff, such as in the Sierra Nevada and in the Upper Colorado and Upper Rio Grande River Basins, lower SWE translates to reduced reservoir water storage.

Economic Impacts
- In early 2014, California received only 29% of average precipitation and the economic consequences of the drought are stacking up. The state faces nearly $450 million in additional costs for groundwater pumping and an estimated $800 million in increased energy costs.
- California produces about 95% of U.S. apricots, almonds, artichokes, figs, kiwis, raisins, olives, cling peaches, dried plums, persimmons, pistachios, olives, and walnuts, in addition to other high-value crops. Drought and extreme weather affect the market value of fruits and vegetables more than other crops because they have high water content and because sales depend on good visual appearance.
- Climate change will increase the cost of maintaining and improving drinking water infrastructure in California, which is already estimated at $4.6 billion annually over the next 10 years. This is because expensive technologies including expanded wastewater treatment and desalinating water for drinking are among the key strategies for supplementing water supplies.
Impacts to Human Health and Wellbeing
- Some 40 million people across seven states depend on the drying Colorado River for water. It also irrigates four million acres of farmland.
- Drought is a special case of natural disaster due to its potential impact on livelihoods, especially farmers’. Due to the 2014 drought in California, there is an estimated loss 17,100 seasonal and full-time jobs and statewide economic cost of $2.2 billion.
- Reduced snowmaking in the Southwest due to climate change is expected to shorten the ski season substantially, with projected losses of 3 to 6 weeks (by the 2050s) and 7 to 15 weeks (2080s) in the Sierra Nevada of California.Decreases from 40 to almost 90% are likely in end-of-season snowpack under a higher emissions scenario in counties with major ski resorts from New Mexico to California.
Recent Events
- In 2013, the Southwest was drier than average. California had its driest year in 119-years of record keeping, with 33% of average precipitation. During the January-May period, the region had below average precipitation. Arizona had its fourth driest start to the year, New Mexico had its second driest and California had its eighth driest.
- The Colorado River basin is the largest in the Southwest and has experienced its driest 14-year period in the last century. From December 2004 to November 2013, it lost 65 cubic kilometers of freshwater. That is almost double the capacity of the country’s largest reservoir (Nevada’s Lake Mead), and equivalent to the water needed to supply more than 50 million households for a year.
- In 2013, locations in California, Nevada, Arizona, and New Mexico had snowpack totals less than 25% of normal. In 2012, snowpack totals less than 50% of normal were widespread in California, Nevada, Utah, Colorado, Arizona, and New Mexico.
Wildfires
Right Here, Right Now
- The broad-scale increase in wildfire frequency across the western U.S. has been driven primarily by sensitivity of fires to recent changes in climate.
- Climate outweighed other factors in determining burned area in the western U.S. from 1916 to 2003.
- The annual number of large wildfires on federally managed lands in 11 western states (including Oregon, Washington, Idaho, Montana, and Wyoming) has increased by more than 75%. There were approximately 140 large wildfire from 1980–1989 to 250 from 2000–2009.
- The western wildfire season has grown from five months on average in the 1970s to seven months today.
- The combined impacts of wildfires and bark beetles killed trees across 20% of Arizona and New Mexico forestsfrom 1984 to 2008.
Projected
- The threat of wildfires is projected to worsen over time with temperatures in the western U.S. rising more rapidly than the global average.
- Models project a doubling of burned area in the southern Rockies, and up to a 74% increase in burned area in California, with northern California potentially experiencing a doubling under a high emissions scenario toward the end of the century.
- An ensemble of 15 climate models predicts a further lengthening of the fire season by 23 days by midcentury.
- The average area burned every year in the western United States will rise dramatically with even 1.8°F of warming. Among the states, Colorado is projected to have the largest increase in area burned, with an annual increase of 400 to 650% for much of the state.
Economic Impacts
- More than 1.2 million homes—with a combined estimated value of more than $189 billion—across 13 western states are at high or very high risk of wildfires. The majority of the highest-risk properties are in California, Colorado, and Texas, which together have nearly 80% of such properties in the western states.
- Total monetary costs associated with any wildfire are difficult to estimate but even partial costs can be staggering. A full accounting of wildfire costs considers long-term and complex costs, including impacts to watersheds, ecosystems, infrastructure, businesses, individuals and the local and national economy. The true costs of wildfire can be 2 to 30 times greater than the commonly reported costs of simply extinguishing the fire.
- The 2003 Grand Prix fire in southern California cost $1.2 billion in damages, including $86 million in damages to roads, bridges, and electricity and gas infrastructure.
- The June 2002 Rodeo-Chediski fire is the second largest fire in Arizona history, burning 462,614 acres. The costs of suppressing the fire were between $43 and $50 million, yet other direct costs, including the loss of homes and property, totaled $122.5 million. Rehabilitation costs were generated from immediate post-fire expenditures, and then projected out over three years for a total cost of $139 million. Indirect costs, including loss of sales tax revenue and job losses in the tribal community amounted to $8.1 million.
| SUPPRESSION | OTHER DIRECT | REHABILITATION | INDIRECT | TOTAL |
|---|---|---|---|---|
| $46,500,000 | $122,500,000 | $139,000,000 | $403,000 | $308,403,000 |

Impacts to Human Health and Wellbeing
- Virtually every urban area in the Southwest has a large ring of homes in forested areas known as wildland-urban interfaces (WUIs). Persistent population growth has led to more homes and businesses being built in and near forested areas that are more prone to wildfires due to climate change.
- Smoke from wildfires causes significant health problems, both when wildfires occur near major population centers and when smoke is carried long distances to populated areas. Aggravation of asthma and heart and lung diseases, breathing difficulties, and even death can result.
- In June 2008, a California wildfire elevated levels of toxic particulate matter to concentrations greatly in excess of air quality standards. The values were among the highest ever reported.
- The 2008 fire season in the Reno and Sparks area of Nevada led to almost $2.2 million in hospital costs caused by wildfires within a 350-mile radius.
- A study analyzing one month during southern California’s 2003 wildfire season found that wildfires resulted in 69 premature deaths, 778 hospitalizations, 1,431 emergency room visits, and 47,605 outpatient visits, mostly for respiratory and cardiovascular health problems aggravated by smoke exposure.
Recent Events
- For 2014, the U.S. government predicted higher-than-normal potential for fires in California and elsewhere in the West because of serious droughts that have left many areas bone dry.
- In 2013, the Rim Fire in California burned over 103,000 hectares, the third largest fire in California history. In Colorado, the Black Forest Fire destroyed over 500 homes near Colorado Springs, making it the most destructive wildfire in Colorado history. In Arizona, the Yarnell Hill Fire was responsible for 19 firefighter fatalities.
- In 2011 and 2012, as the U.S. experienced intense drought, there were record-breaking wildfires in New Mexico, Arizona, and Colorado. In Colorado, fires in 2012 destroyed more than 700 homes.
- The Wallow Fire of 2011 was the largest fire in Arizona history. It burned 535,000 acres of the Apache-Sitgreaves National Forest in 5 weeks. During the previous 25 years, planned and unplanned burned areas in the National Forest totaled 581,000 acres.
Sea Level Rise
Right Here, Right Now
- In the last 100 years, sea level has risen along the California coast by 6.7 to 7.9 inches.
- Eighty-seven percent of all Californians live in coastal counties, and 80% of the state’s GDP is derived from those counties.
Projected Trends
- While sea level along the California coast has been relatively constant since 1980, both global and relative Southwest sea levels are expected to increase at accelerated rates.
- During the next 30 years, the greatest impacts will be seen during high tides and storm events. Rising sea level will allow waves to reach farther inland and extend high tide periods, worsening coastal erosion on bluffs and beaches and increasing flooding potential.
- Sea level rise will vary across California, in part due to tectonic plate activity: Los Angeles (1.5 to 2.9 feet by 2100), Santa Monica (1.7 to 3.1 feet by 2100), and San Francisco (1.8 to 3.2 feet by 2100) will likely see lower rise than San Diego (1.9 to 3.4).
- The real sea level risk in this region is in the tails. The California coastline is more exposed to sea level rise resulting from Antarctic melt than the global average, and there is a 1-in-100 chance that sea levels could rise by as much as 5.5 feet by 2100 in San Diego.

Economic Impacts
- Sea level rise threatens California’s ocean-based economy, which is the nation’s largest, estimated at $46 billion annually.
- An estimated $100 billion worth of property is at risk of flooding and 1,900 miles of California’s roadways are vulnerable from a 100-year flood event with a 3.3 feet sea-level rise. An overwhelming two-thirds of that property is concentrated in San Francisco Bay and the majority of this property is residential.
- Sea level rise of 3.3 feet would threaten San Francisco Bay infrastructure valued at $48 billion.
- Beyond critical assets, a major component of Los Angeles’ economy is dependent upon beach tourism. In 2012, the Los Angeles region attracted over 41 million tourists, who accounted for more than $16.5 billion in expenditures.
Impacts to Human Health and Wellbeing
- A wide range of critical infrastructure in California—such as roads, hospitals, schools, emergency facilities, wastewater treatment plants, power plants, and more—will be at increased risk of inundation in a 100-year flood event.
- Projected increases in extreme coastal flooding as a result of sea level rise will increase human vulnerability to coastal flooding events.
- 260,000 people in California are currently at risk from what is considered a once-in-100-year flood. With a sea level rise of about 3 feet, 420,000 people would be at risk from a 100-year flood event.
Recent Events
- Most of the major storm damage in the central coastal area over the past century has taken place during El Niño years when large waves reached the coast at times when sea level was elevated. The El Niño winters of 1977-78, 1982-83, and 1997-98 inflicted major damage on many of the developed and heavily populated portions of California’s shoreline.
- Prior to 1983, the last hurricane-generated storm to reach the southern California coast occurred in September 1939. Following the warm-water ENSO event of 1982-83 in the Pacific, storms of this type have become more frequent. In 1988, a storm hit the coast of southern California with peak offshore wave heights of over 30 feet. Damage to oceanfront structures and infrastructure exceeded $43 million.
- In the last decade, high tides on top of sea level rise have contributed to new damage to infrastructure, such as the inundation of Highway 101 near San Francisco and backup of seawater into the San Francisco Bay Area sewage systems.