CLIMATE SIGNALS
Whether or not we are aware of it, events amplified by climate change are happening all the time. Climate Signals identifies and illustrates what climate change looks like on the ground, in your region, state, or neighborhood and specifies the long-term climate trends and physical processes at work.
The relation between individual extreme events and broader climate trends can be very complex. Climate Signals clarifies the links by identifying the chain of connections between greenhouse gas emissions and individual climate events – such as Hurricane Katrina.
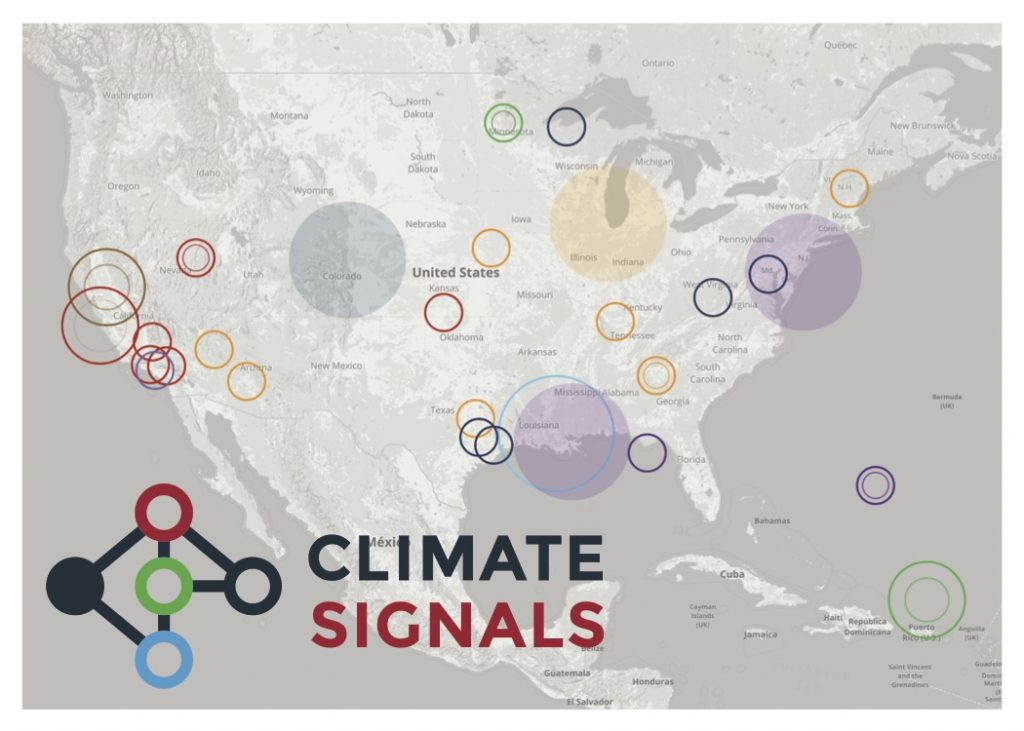
Climate Signals consists of a curated relational database of events and their links to climate change, an event mapping engine, a searchable database of science reports, and a searchable gallery of climate change monitors relaying real-time data.
For each event in the database, an infographic engine provides a custom “signal tree” that illustrates the connections to climate change. The system of attribution used to link events to climate change is explained here. In addition, key resources are aggregated and curated for each event.
Climate Signals is a science information project of Climate Nexus.


